Institutional Evolution
Follow positioning, participation and structural context in a single institutional view.
Understand where institutional capital is positioned, how pressure builds across markets, and when structures begin to shift.
Follow positioning, participation and structural context in a single institutional view.
See where capital is concentrating and which assets lead the weekly institutional map.
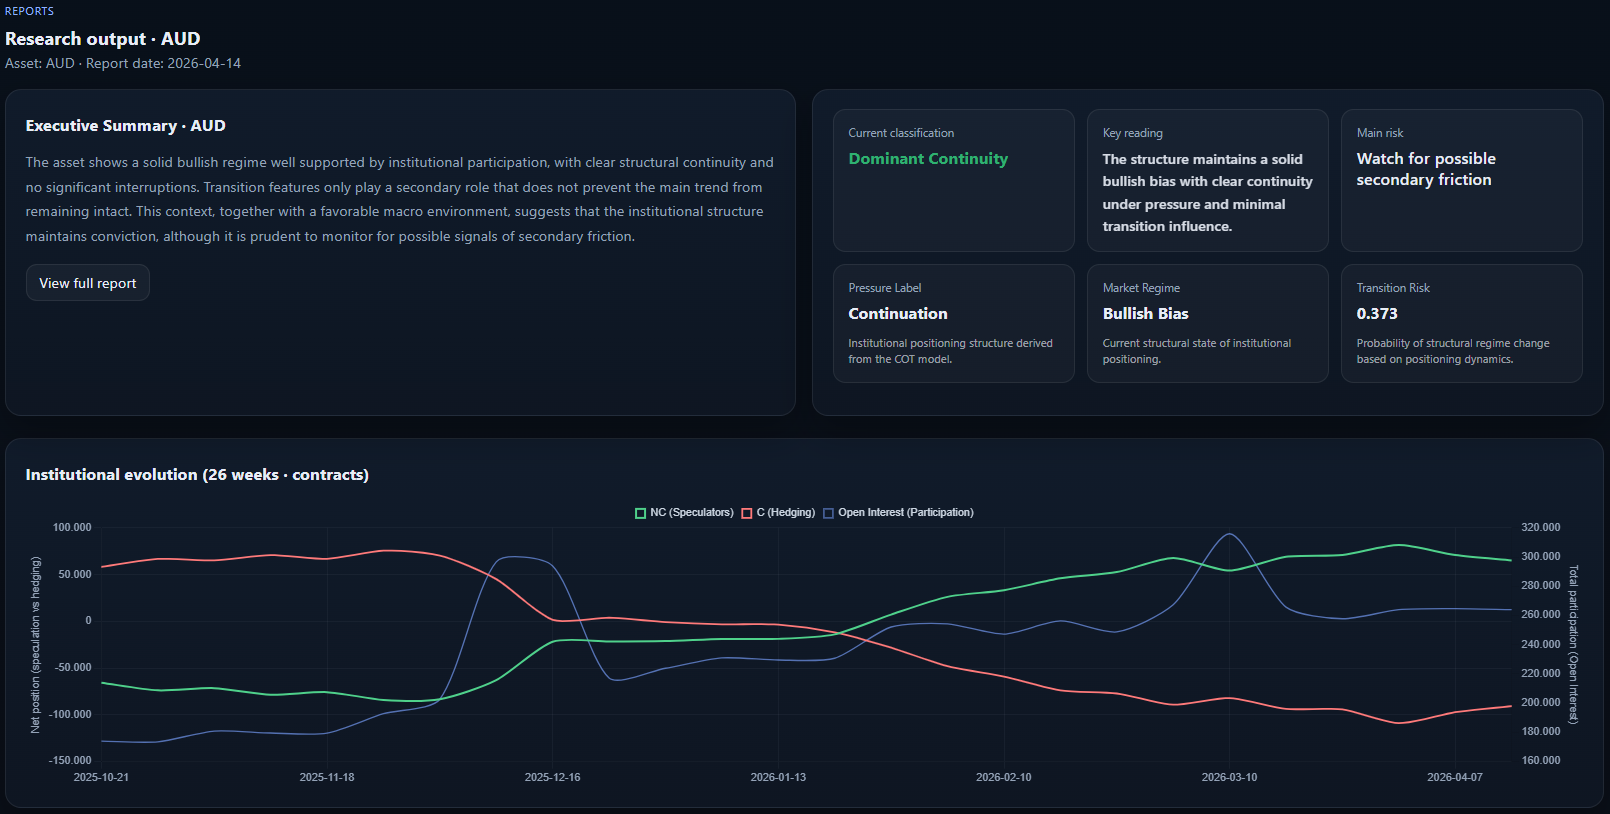
Review the real weekly evolution of Non-Commercial, Commercial and Open Interest data.
Price can move without telling you whether participation, conviction or structural quality are actually supporting it.
Signals, predictions and generic indicators often create false certainty instead of improving market understanding.
COT and macro structure are powerful, but most retail users are rarely given a clear way to interpret them in one place.
Not indicators. Not price guesses. A structured institutional classification showing where capital is active and how each market is positioned.
Track how commercial and non-commercial participants are positioned across the institutional universe.
Measure whether capital is entering, validating and sustaining the current structure.
Use FRED and structural macro context to understand the broader environment behind institutional positioning.
Read a market through institutional summary, structural snapshot and real weekly evolution without leaving the same workflow.
From weekly market orientation to structural rankings, deep asset reports and comparative research, SORI organizes institutional data into a usable workflow.
Start with the weekly market map to understand where participation, pressure and structural clarity are concentrated across the institutional universe.
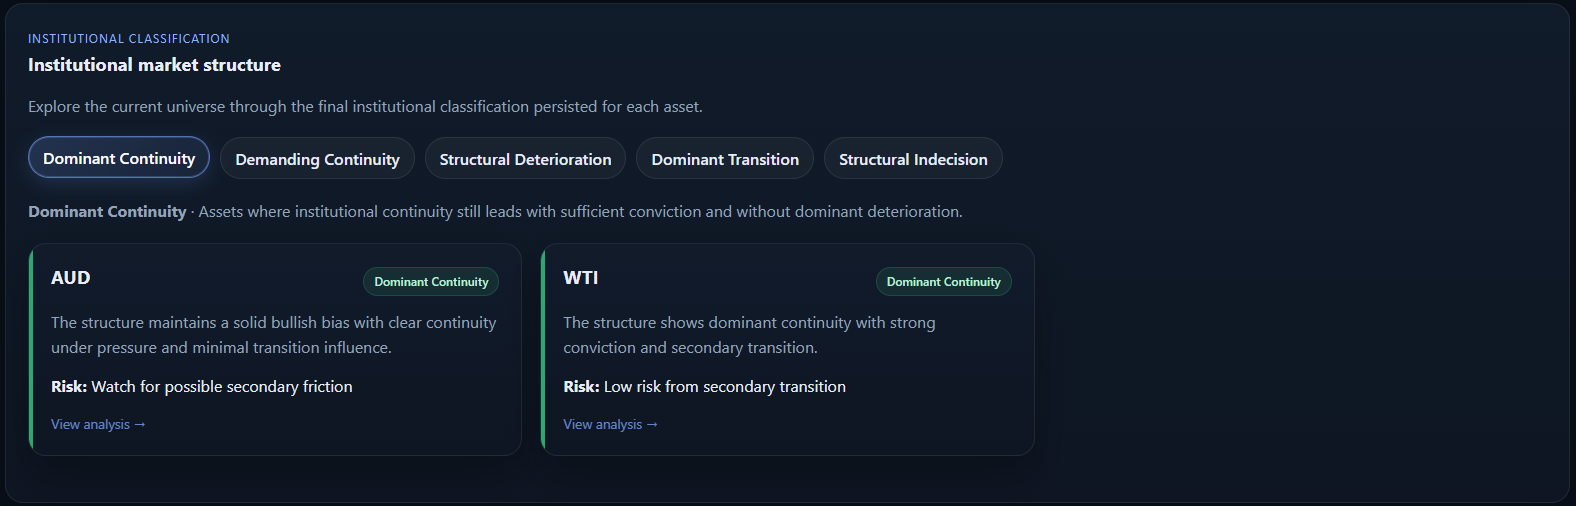
Explore leadership, structural classifications, category rankings and convergences to understand how the market is distributed beneath price.
Use institutional reports, structural snapshots and weekly evolution charts to study how a market is positioned and how its regime is changing.
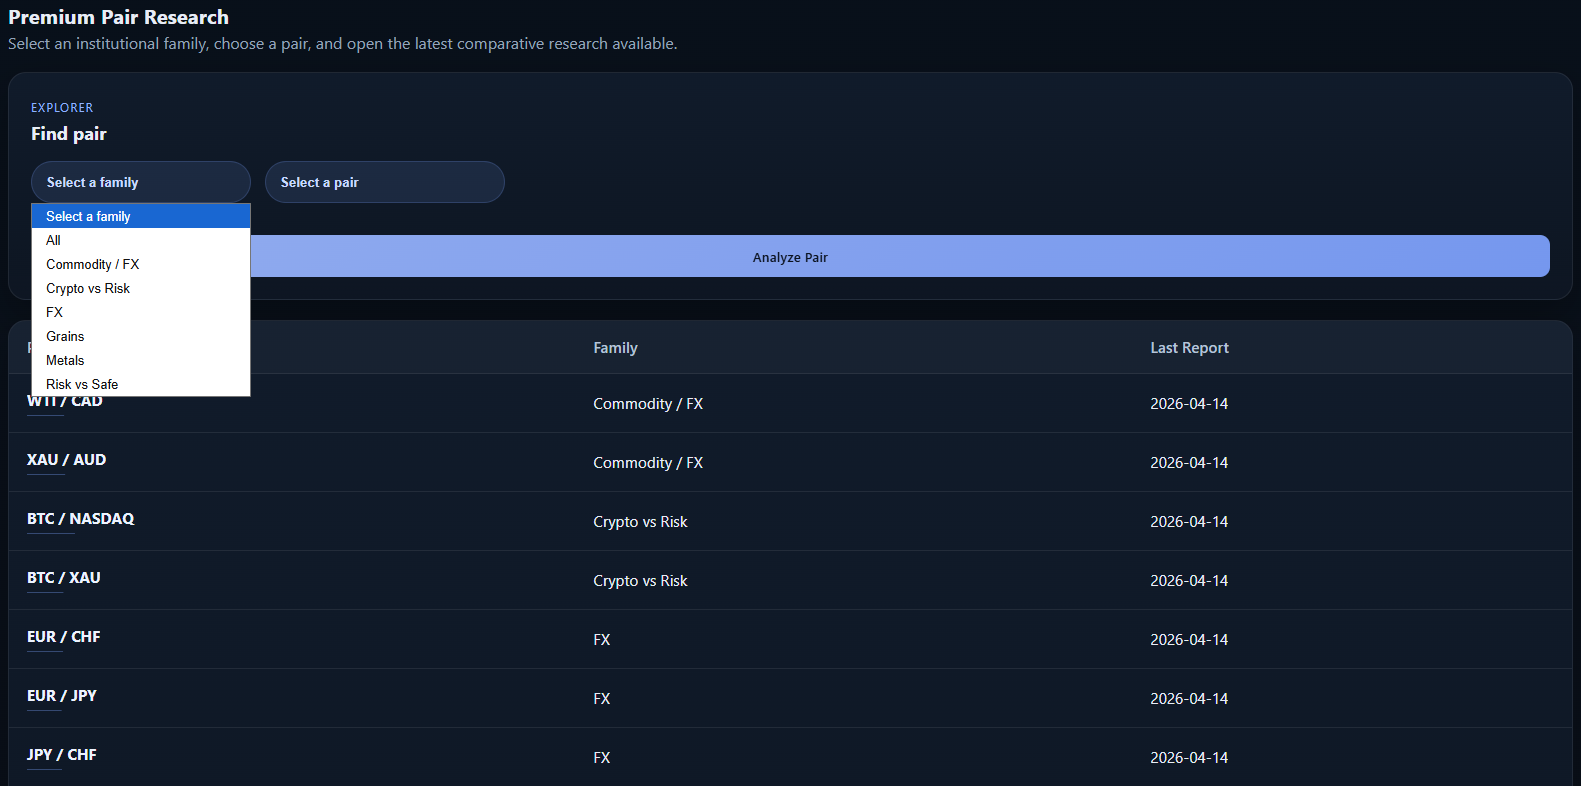
Evaluate relative strength and structural contrast across official pairs to identify where capital is stronger, weaker or rotating.
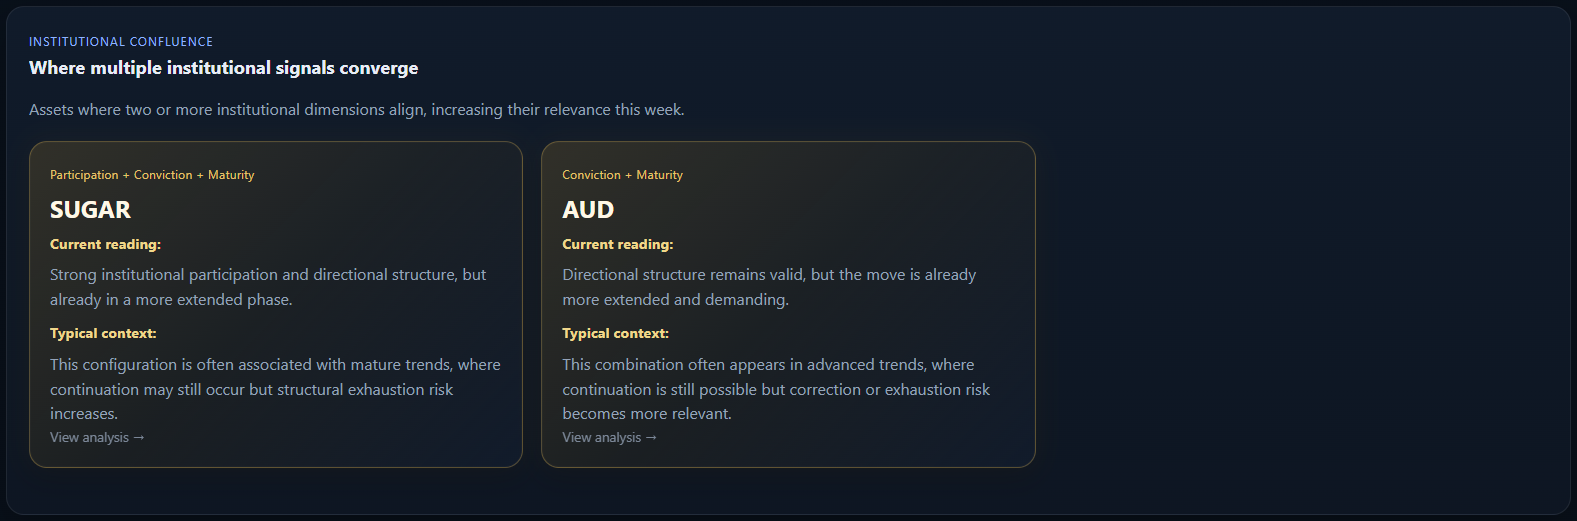
SORI highlights where participation, conviction, maturity and structure converge, making institutional relevance easier to identify.
Relative strength matters. Official pair research helps compare assets, read structural contrast and detect where capital is stronger or rotating.
SORI is not a signal platform. It is a research system built to help you understand institutional market structure.
No. SORI does not generate buy or sell signals. It analyzes institutional positioning, participation, transition and macro context so you can understand what is happening before making decisions.
SORI does not rely on generic indicators or price-based signals. It organizes institutional data into a structured reading of participation, conviction, transition and market regime.
No. SORI is designed to make complex institutional data easier to read. You do not need to manually process COT, Open Interest, FRED or historical context.
Because SORI does not impose trades. It shows the institutional state of each asset so you can focus on markets you already know, follow or understand better.
Because markets are not linear. An asset can show strong conviction while also developing transition pressure. That is not a contradiction; it is a deeper institutional reading.
SORI uses institutional and macro data such as COT, Open Interest, positioning, historical context and FRED macro series to build a structural market reading.
No. SORI is focused on structural context over weeks and months. It helps you understand institutional behavior instead of chasing short-term market noise.
Regular gives access to individual asset research and reports. Premium unlocks Rankings, Premium Pairs, institutional comparisons and the full cross-asset research system.
Access a research system built to make institutional positioning, participation and macro structure readable in one place.