Most retail traders spend years staring at charts, indicators and candlestick patterns without ever asking a much deeper question: who is actually moving the market behind the scenes? That is exactly where the Commitment of Traders report becomes incredibly powerful. If you have ever wondered what is the COT Report, why professional traders care about it so much, or why markets sometimes move in ways that technical indicators simply cannot explain, then understanding the COT Report can completely change the way you see financial markets.
One of the biggest mistakes I see traders make is believing that price alone tells the whole story. In reality, markets behave more like a giant tug of war between different groups of participants. Some are trying to protect businesses, some are speculating aggressively, and others are simply reacting emotionally. The COT gives us one of the few public windows into that institutional participation. It helps us understand not only where money is positioned, but also how strong market conviction may actually be beneath the surface. In many ways, learning what the COT Report is feels less like finding another indicator and more like finally seeing the larger chessboard that institutions have been watching all along.
As we go deeper into this guide, I will break down the COT Report explained in the simplest way possible. We will cover how the COT Report works, who participates in it, how institutional traders interpret positioning data, why participation matters more than most retail traders realize, and why macroeconomic conditions often shape market behavior far more than people think. By the end, you will not only understand how to read the COT Report, but also why institutional positioning can reveal a side of the market that charts alone simply cannot show.
What Is the COT Report?
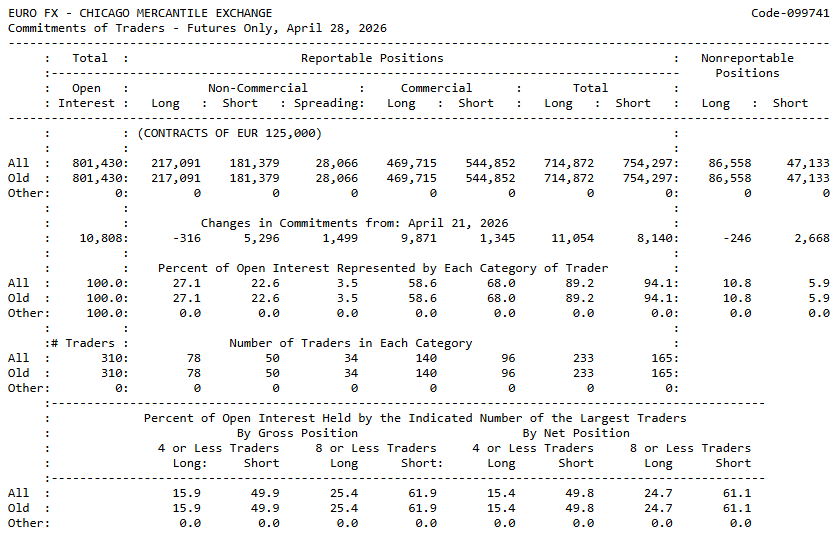
The Commitment of Traders report, also known as the COT Report, is a weekly publication released by the Commodity Futures Trading Commission. Its purpose is surprisingly simple: it shows how different groups of traders are positioned in the futures market.
Think about it like this.
Imagine watching a football game, but only seeing the scoreboard. You can see the score changing, but you cannot see who is attacking, who is defending, or which team is controlling the game. That is how most traders look at charts.
The COT tries to show what is happening behind the scoreboard.
Instead of only showing price movement, it reveals:
- who is buying,
- who is selling,
- who is heavily exposed,
- and how institutional participation is evolving over time.
That is why many professional traders consider understanding the COT Report extremely valuable. It gives context to market behavior that price alone often hides.
Why the COT Report Exists
Futures markets are enormous. Every single day, banks, hedge funds, institutions, producers and speculators are constantly making decisions that influence prices all around the world. Oil companies are trying to protect themselves from rising energy costs, agricultural businesses are managing uncertainty in crop prices, hedge funds are placing large directional bets, and institutions are adjusting exposure based on changing economic conditions.
Most retail traders never truly see this hidden layer of the market.
They only see the final result:
price moving up or down on a chart.
But behind every major move, there is usually a much bigger story happening underneath the surface.
That is exactly why the Commodity Futures Trading Commission created the Commitment of Traders report.
The purpose of the COT Report is surprisingly simple:
to provide transparency into how large participants are positioned in futures markets.
In other words, the report helps the public understand what institutional participation actually looks like.
And this matters far more than most people realize.
Many beginners enter trading believing markets move mostly because of:
- chart patterns,
- indicators,
- trend lines,
- or emotional reactions.
But as traders gain experience, they usually begin to notice something important:
markets are heavily influenced by institutional behavior, risk management and macroeconomic conditions.
For example, imagine trying to understand traffic in a city by only looking at a single street corner. You may see cars moving, but you still would not understand:
- where traffic is coming from,
- why congestion is building,
- or which roads are influencing the entire system.
That is how many traders approach markets when they only study price charts.
The COT helps widen the perspective.
It allows traders to step back and observe how larger market participants are behaving behind the scenes. It does not predict the future with certainty, and it is not a magical trading signal, but it does provide context that charts alone often cannot show.
In many ways, learning how the COT Report works feels less like adding another indicator and more like finally understanding that markets are driven by participation, positioning and institutional decision-making — not just candles moving randomly on a screen.
The deeper I studied institutional positioning myself, the more I realized that some of the biggest market moves often begin quietly, long before retail traders fully recognize what is changing beneath the surface.
How the COT Report Works
Every week, large traders in futures markets report their positions to regulators.
The data is then grouped into categories and published publicly.
The report typically shows:
- long positions,
- short positions,
- changes from previous weeks,
- and overall participation levels.
At first, the report may look intimidating because it contains many numbers. But once you understand the logic behind it, the structure becomes surprisingly intuitive.
I often compare it to looking at traffic in a city.
Price charts show you the cars moving.
The COT Report explained simply:
it shows you who owns the trucks, buses and massive vehicles capable of influencing traffic itself.
That difference is enormous.
Who Participates in the COT Report?
One of the most important parts of understanding the Commitment of Traders report is realizing that the market is not made up of one single type of trader.
This is something many retail traders overlook at the beginning.
They see price moving on a chart and assume everyone in the market is trying to achieve the same thing:
buy low, sell high and make money.
But futures markets are far more complex than that.
Behind every move, there are completely different participants interacting with the market for completely different reasons.
Some traders are trying to protect billion-dollar businesses from unpredictable price fluctuations.
Some institutions are placing large speculative bets based on macroeconomic expectations.
Others are reacting emotionally to headlines, fear or momentum.
Imagine a giant ocean where:
- some ships are transporting goods carefully across the world,
- some speedboats are racing aggressively for profit,
- and some small boats are simply trying not to get caught in the storm.
They are all moving in the same water, but they are not operating with the same objectives, the same information or the same level of influence.
Markets behave very similarly.
That is why understanding these differences becomes one of the most important foundations of proper smart money analysis. Because the real value of the COT Report is not just seeing numbers on a table — it is understanding who is behind those positions and why they may be behaving that way.
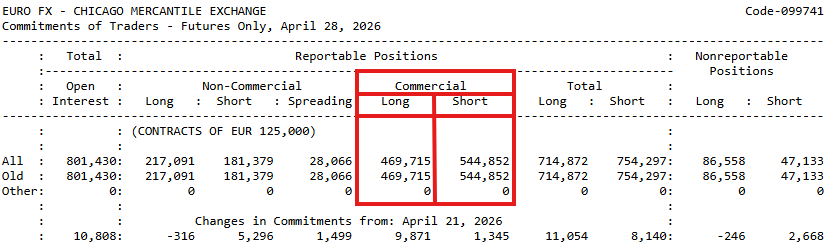
Commercial Traders
Commercial traders are usually businesses or institutions that use futures markets to protect themselves against risk.
These can include:
- banks,
- energy companies,
- food producers,
- large exporters,
- commodity firms,
- or corporations exposed to price fluctuations.
This process is called hedging.
For example, imagine a coffee company worried that coffee prices may suddenly rise. Instead of waiting and hoping for the best, they may use futures contracts to lock in prices ahead of time.
In many cases, commercial hedgers are not trying to “beat the market” like retail traders. They are trying to reduce uncertainty.
That is why commercial behavior inside the COT Report is often interpreted differently from speculative positioning.
Many traders underestimate how important commercial hedgers really are. In my experience, understanding their behavior often reveals how institutions perceive long-term market conditions far better than social media sentiment ever could.
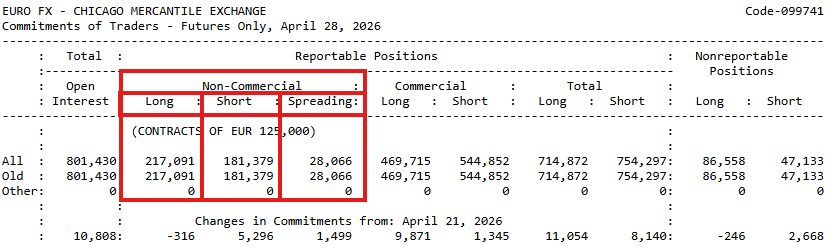
Non-Commercial Traders
Non-commercial traders are usually large speculators.
This category often includes:
- hedge funds,
- institutional traders,
- large speculative firms,
- and professional money managers.
Unlike commercial participants, these traders are usually trying to profit directly from price movement.
This is where institutional participation becomes extremely interesting.
When large speculators aggressively increase positions, it can sometimes reveal:
- growing conviction,
- strong directional bias,
- increasing momentum,
- or broad institutional alignment.
However, one mistake many traders make is assuming institutions are always right.
Institutions can become overcrowded too.
Markets sometimes reverse violently when positioning becomes excessively one-sided. That is one reason why professional traders study institutional positioning carefully instead of blindly following it.
Non-Reportable Traders
Non-reportable traders are typically smaller participants.
This category often represents:
- retail traders,
- small independent speculators,
- or traders with positions too small to require reporting.
Compared to large institutions, their influence on overall futures positioning is usually much smaller.
That does not mean retail traders cannot succeed.
But it does mean markets are often heavily shaped by participants with:
- larger capital,
- deeper liquidity access,
- institutional research,
- and macroeconomic models.
Understanding this reality is an important part of learning what the COT Report is truly showing beneath the surface.
What Information Does the COT Report Actually Show?
At first glance, the COT Report can look like a giant spreadsheet full of confusing numbers.
But the core ideas are actually simple.
The report mainly helps traders understand:
- who is positioned long,
- who is positioned short,
- how participation is changing,
- and whether institutional conviction appears to be increasing or weakening.
Long Positions
A long position means a participant benefits if prices rise.
If institutions are increasing long positions aggressively, it can sometimes indicate growing optimism or stronger conviction.
However, context matters enormously.
A market can still decline even if many participants are long. That is why understanding institutional positioning requires much more than simply copying numbers from the report.
Short Positions
A short position means a participant benefits if prices fall.
Short positioning can increase for many reasons:
- hedging,
- risk protection,
- speculative bearish expectations,
- or macroeconomic concerns.
This is one reason why the COT Report explained properly requires understanding why participants are positioned a certain way, not only where they are positioned.
Net Positioning
Net positioning compares long and short exposure.
This helps traders evaluate whether institutions are overall:
- bullish,
- bearish,
- or relatively neutral.
Think of it like watching crowd behavior before a storm.
If almost everybody suddenly runs in one direction, it tells you something important about market perception.
But extreme positioning can also signal vulnerability.
Sometimes when everyone already expects the same outcome, markets become unstable because there are few participants left to continue pushing the move.
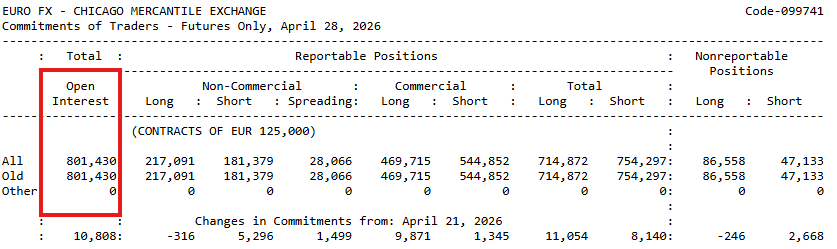
Open Interest
Open Interest is one of the most important — and most misunderstood — concepts in futures market analysis.
In very simple terms, Open Interest measures how many active contracts currently exist in the market.
You can think of it like participation inside a stadium.
Price movement alone only shows whether the crowd is cheering louder or quieter.
Open Interest helps reveal:
- whether more participants are entering the stadium,
- whether participation is shrinking,
- or whether institutional activity is supporting the move.
This matters enormously because strong trends usually require participation.
A market rising with weak participation can behave very differently from a market rising with strong institutional involvement.
We will explore Open Interest in much greater depth in a future article because it deserves an entire discussion on its own.
Weekly Position Changes
The Commitment of Traders report also shows how positions evolve week after week.
These changes can sometimes reveal:
- increasing conviction,
- weakening momentum,
- structural transitions,
- or changing institutional sentiment.
In many ways, experienced traders often focus less on the raw numbers and more on how positioning behavior changes over time.
That shift in perspective is extremely important when learning how to read the COT Report correctly.
Why Open Interest Is So Important
Many traders spend years analyzing candles while completely ignoring participation.
But participation matters.
Imagine seeing a restaurant with a huge line outside every day. That tells you something very different from an empty restaurant with a flashy sign.
Markets behave similarly.
When Open Interest grows, it may suggest:
- stronger market engagement,
- increasing institutional participation,
- or broader conviction behind price movement.
When Open Interest declines, it can sometimes indicate:
- weakening participation,
- reduced conviction,
- or fading momentum.
One thing I have learned over time is that institutional traders rarely focus only on direction. They also pay close attention to the quality of participation behind the move.
That is one reason why futures market analysis becomes much deeper once traders begin studying positioning and participation together instead of treating charts as isolated signals.
How Institutional Traders Use the COT Report
One of the biggest misconceptions about the COT Report is believing institutional traders use it like a magical buy or sell button.
They do not.
In fact, that idea alone is one of the reasons many retail traders misunderstand markets completely.
Most beginners approach the market searching for certainty. They want an indicator that tells them:
- when to buy,
- when to sell,
- and where price will go next.
But institutional traders usually think very differently.
They are not obsessed with finding perfect signals.
They are trying to understand:
- who is participating,
- how strong positioning really is,
- whether conviction is increasing or fading,
- how liquidity is behaving,
- and whether broader market conditions support the current move.
That difference in mindset changes everything.
The deeper I studied institutional behavior, the more I realized that professionals often care less about predicting the next candle and more about understanding the environment driving the market underneath the surface.
Think about it like professional poker players.
Beginners focus almost entirely on the cards in their own hands.
Professionals focus on:
- positioning,
- behavior,
- pressure,
- risk,
- probabilities,
- and how every player at the table is reacting.
Institutional traders often approach the COT the same way.
They are constantly asking questions like:
- Is participation expanding or weakening?
- Are large speculators overcrowded?
- Is institutional conviction increasing?
- Is the market becoming vulnerable to reversal?
- Is this trend being supported by healthy participation or emotional momentum?
That is why understanding how institutional traders use the COT Report is much deeper than simply searching for bullish or bearish signals.
The report is not valuable because it predicts the future perfectly.
It is valuable because it helps reveal the hidden behavior of large market participants.
And markets are heavily influenced by behavior.
I often compare institutional analysis to weather forecasting.
A meteorologist does not look at one cloud and immediately predict a hurricane.
They study:
- pressure systems,
- humidity,
- wind direction,
- ocean temperature,
- atmospheric shifts,
- and how conditions evolve together over time.
Markets behave very similarly.
Professional traders rarely make decisions from isolated data points. They combine positioning, macroeconomic conditions, participation quality, liquidity and market structure to build a broader understanding of what may be happening beneath the surface.
In many ways, the COT Report explained properly is less about predicting exact price movement and more about learning how to read the behavior of the market itself.
And in my experience, that perspective is often what separates reactive retail trading from true institutional thinking.
How Smart Money Uses the COT Report
The phrase “smart money” is often exaggerated online, but institutional behavior still matters enormously.
Large participants frequently study:
- positioning imbalances,
- participation shifts,
- crowd exposure,
- and structural conditions.
The how smart money uses the COT Report concept is less about predicting exact market turns and more about understanding where institutional pressure may be building beneath the surface.
For example:
if speculative positioning becomes extremely crowded while participation weakens, institutions may become more cautious even if price still looks strong on the chart.
That is one reason why understanding institutional market behavior often provides insights that technical indicators alone cannot fully capture.
The Biggest Mistakes Retail Traders Make With the COT Report
One of the most common mistakes retail traders make is treating the COT Report like a shortcut to easy profits.
Markets do not work that way.
The report is a tool for interpretation, not a magic formula.
Mistake #1: Treating the COT Like a Signal Generator
Many traders search for:
- “buy signals,”
- “sell signals,”
- or instant confirmations.
But institutional positioning is rarely that simple.
The market can remain heavily positioned in one direction for long periods before price reacts differently.
That is why understanding the COT Report explained properly requires patience and context.
Mistake #2: Ignoring Macroeconomic Conditions
Positioning never exists in isolation.
Interest rates, inflation, central bank policy and liquidity conditions all influence institutional behavior.
A positioning shift without macro context can easily become misleading.
This is one reason why many experienced traders eventually move beyond pure chart analysis and begin studying broader market environments.
Mistake #3: Ignoring Participation Quality
Not all market moves are equally strong.
Some trends are supported by:
- growing participation,
- expanding conviction,
- and institutional alignment.
Others are driven mostly by short-term speculation.
Learning to recognize the difference is one of the most valuable aspects of understanding futures positioning.
Mistake #4: Blindly Following Institutions
Another dangerous misconception is believing institutions are always correct.
Institutions can:
- overextend,
- become crowded,
- miscalculate,
- or react emotionally during stressful environments.
Professional analysis is not about worshipping institutional traders.
It is about understanding participation behavior objectively.
Why the COT Report Alone Is NOT Enough
One of the most important lessons traders eventually learn is that positioning alone does not control markets.
The broader macro environment matters enormously.
This includes:
- inflation,
- interest rates,
- central bank policy,
- liquidity conditions,
- economic growth,
- recession fears,
- and currency strength.
For example, institutional positioning may look bullish while macroeconomic conditions simultaneously deteriorate beneath the surface.
That contradiction matters.
Markets behave more like ecosystems than machines.
Everything interacts together.
That is why many professional traders combine:
- institutional positioning,
- market structure,
- macroeconomic conditions,
- and participation analysis.
In many cases, understanding futures market context becomes far more important than searching for isolated indicators.
Why Macroeconomic Context Matters
Imagine trying to understand ocean waves without studying the weather.
You might see movement, but you would miss the forces creating it.
Markets work similarly.
Institutional behavior is heavily influenced by:
- central bank decisions,
- liquidity availability,
- economic stress,
- and broader financial conditions.
That is why many traders use macroeconomic data platforms like FRED (Federal Reserve Economic Data) to better understand the environment behind market positioning.
The deeper I studied institutional participation, the more I realized that charts alone rarely explain the full story.
| Pros | Contras |
|---|---|
| The COT Report reveals institutional positioning behind market movements | Watching price alone hides who is actually driving the market |
| Helps traders understand real market participation instead of relying only on indicators | Pure price analysis often creates emotional and reactive trading decisions |
| Provides insight into how hedge funds and large institutions are behaving | Charts alone rarely explain why markets suddenly reverse or accelerate |
| Allows traders to evaluate market conviction and positioning strength | Price without context can create misleading bullish or bearish signals |
| Improves understanding of long-term institutional market behavior | Retail traders often become trapped following short-term market noise |
| Helps identify crowded positioning and possible market vulnerabilities | Ignoring participation can make trends appear stronger than they truly are |
| Encourages traders to think in probabilities and macro context | Price-only trading usually ignores liquidity and institutional conditions |
| Provides a deeper perspective beyond technical indicators alone | Charts cannot fully reveal institutional risk management behavior |
| Helps traders understand the hidden structure behind futures markets | Analyzing price in isolation often oversimplifies how markets truly function |
How SORI Interprets Institutional Market Structure
At SORI, we believe markets become much clearer when positioning is viewed as part of a larger institutional framework.
Instead of treating the Commitment of Traders report as an isolated indicator, we focus on combining:
- participation,
- positioning,
- structural behavior,
- macro conditions,
- transitions,
- and historical context.
In many ways, markets behave like living systems.
They evolve through phases:
- accumulation,
- expansion,
- exhaustion,
- transition,
- and redistribution.
Institutional positioning often shifts gradually throughout these phases long before retail traders fully recognize what is happening.
That is why understanding institutional layers becomes so important.
A strong market move with weak participation may tell a very different story from a move supported by broad institutional conviction and healthy liquidity conditions.
At SORI, the goal is not simply to predict price.
The goal is to understand the environment driving price behavior beneath the surface.
Because in reality, institutional participation often reveals far more than candles ever can on their own.
Frequently Asked Questions About the COT Report
Conclusion: The Institutional Side of the Market Most Traders Never See
Most traders spend years trying to master indicators, patterns and chart formations while completely overlooking one of the most important forces behind financial markets: institutional behavior.
The Commitment of Traders report offers something extremely rare. It gives us a public glimpse into how different groups are positioned inside futures markets. It helps us understand participation, conviction and broader market structure in ways that price alone simply cannot reveal.
But perhaps the most important lesson is this:
The COT Report is not a magical prediction tool.
It is a framework for understanding market behavior more deeply.
The deeper I studied institutional participation, the more I realized that markets are driven by layers of positioning, macroeconomic conditions, liquidity and structural transitions that most retail traders never even consider.
That is why learning how the COT Report works, understanding institutional positioning and studying participation quality can completely transform the way traders interpret markets.
Because price may show what the market is doing.But institutional positioning often helps explain why.